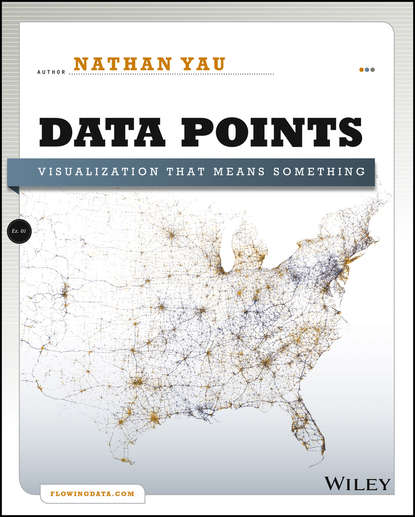
"Data Points: Visualization That Means Something" - книга автора Натана Яу, который ранее написал бестселлер "Visualize This". Она представляет свежий взгляд на визуализацию данных, которая становится все более популярной в современном мире. В книге автор использует примеры из искусства, дизайна, бизнеса, статистики, картографии и онлайн-медиа для исследования как стандартных, так и нетрадиционных концепций и идей визуализации данных. Книга содержит множество интересных идей и примеров от профессионалов в области статистики, искусства, дизайна, бизнеса, компьютерных наук, картографии и многих других областей. Автор рассматривает стандартные правила визуализации данных и исследует, когда и где их можно нарушить. "Data Points: Visualization That Means Something" поможет создавать визуализации, которые будут понятны на всех уровнях.
A groundbreaking new visual aesthetic—and a splendid companion to Nathan Yau's bestseller "Visualize This"--places "Data Points: Visualization that Means Something" squarely in the middle of the fresh influx of brilliant thinking from masters that demands the attention of anyone grappling with visualizing information. Accuracies old and new, intriguing insights, delightful anecdotes, playful examples, real stories, clear directions--every bit of ground covered offers imaginative revelations never seen before. The digital cavalry has joins forces once again with an artist whose boundless curiosity is committed to charting a fundamentally new way forward through the sometimes chaotic world of visual intelligence.
Электронная Книга «Data Points. Visualization That Means Something» написана автором Nathan Yau в году.
Минимальный возраст читателя: 0
Язык: Английский
ISBN: 9781118462225
Описание книги от Nathan Yau
A fresh look at visualization from the author of Visualize This Whether it's statistical charts, geographic maps, or the snappy graphical statistics you see on your favorite news sites, the art of data graphics or visualization is fast becoming a movement of its own. In Data Points: Visualization That Means Something, author Nathan Yau presents an intriguing complement to his bestseller Visualize This, this time focusing on the graphics side of data analysis. Using examples from art, design, business, statistics, cartography, and online media, he explores both standard-and not so standard-concepts and ideas about illustrating data. Shares intriguing ideas from Nathan Yau, author of Visualize This and creator of flowingdata.com, with over 66,000 subscribers Focuses on visualization, data graphics that help viewers see trends and patterns they might not otherwise see in a table Includes examples from the author's own illustrations, as well as from professionals in statistics, art, design, business, computer science, cartography, and more Examines standard rules across all visualization applications, then explores when and where you can break those rules Create visualizations that register at all levels, with Data Points: Visualization That Means Something.


